The tickless kernel in Fedora allows the CPU to enter the idle state more frequently, reducing power consumption and improving power management. The new
PowerTOP tool identifies specific components of kernel and user-space applications that frequently wake up the CPU.
PowerTOP was used in development to perform the audits described in
Section 3.13, “Optimizations in User Space” that led to many applications being tuned in this release, reducing unnecessary CPU wake up by a factor of ten.
Fedora 20 comes with version 2.x of
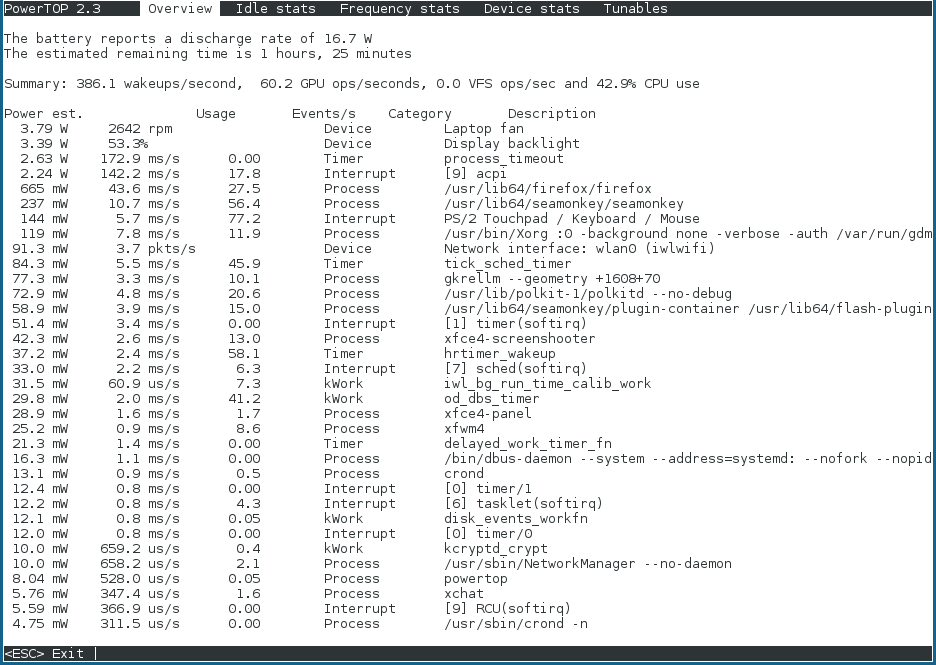
PowerTOP. This version is a complete rewrite of the 1.x code base. It features a clearer tab-based user interface and extensively uses the kernel "perf" infrastructure to give more accurate data. The power behavior of system devices is tracked and prominently displayed, so problems can be pinpointed quickly. More experimentally, the 2.x codebase includes a power estimation engine that can indicate how much power individual devices and processes are consuming. Refer to
Figure 2.1, “PowerTOP in Operation”.
Install PowerTOP with the command:
yum install powertop
PowerTOP can provide an estimate of the total power usage of the system and show individual power usage for each process, device, kernel work, timer, and interrupt handler. Laptops should run on battery power during this task. To calibrate the power estimation engine, run the following command as root:
powertop --calibrate
Calibration takes time. The process performs various tests, and will cycle through brightness levels and switch devices on and off. Do not touch the machine during the calibration. When the calibration process finishes, PowerTOP starts as normal. Let it run for approximately an hour to collect data. When enough data is collected, power estimation figures will begin appearing in the first column.
You can run PowerTOP with the following command as root:
powertop
If you are executing the command on a laptop, it should still be running on battery power so that all available data will be presented.
While it runs,
PowerTOP gathers statistics from the system. In the
Overview tab, you can view a list of the components that are either sending wake-ups to the CPU most frequently or are consuming the most power (refer to
Figure 2.1, “PowerTOP in Operation”). The adjacent columns display power estimation, how the resource is being used, wakeups per second, the classification of the component (such as process, device, or timer), and a description of the component. Wakeups per second indicates how efficiently the services or the devices and drivers of the kernel are performing. Less wakeups means less power is consumed. Components are ordered by how much further their power usage can be optimized.
Tuning driver components typically requires kernel changes, which is beyond the scope of this document. However, userland processes that send wakeups are more easily managed. First, determine whether this service or application needs to run at all on this system. If not, simply deactivate it. To turn off an old SYSV service permanently, run:
systemctl disable servicename.service
For more details about the the process, run:
ps -awux | grep processname
strace -p processid
If the trace looks like it is repeating itself, then you probably have found a busy loop. Fixing such bugs typically requires a code change in that component, which again goes beyond the scope of this document. Please report such issues into the Bugzilla.
As seen in
Figure 2.1, “PowerTOP in Operation”, total power consumption and the remaining battery life are displayed, if applicable. Below these is a short summary, featuring total wakeups per second, GPU operations per second, and virtual filesystem operations per second. In the rest of the screen there is a list of processes, interrupts, devices and other resources sorted according their utilization. If properly calibrated, a power consumption estimation for every listed item in the first column is shown as well.
Use the Tab and Shift+Tab keys to cycle through tabs. In the Idle stats tab, use of C-states is shown for all processors and cores. In the Frequency stats tab, use of P-states including the Turbo mode (if applicable) is shown for all processors and cores. The longer the CPU stays in the higher C- or P-states, the better (C4 being higher than C3). This is a good indication of how well CPU usage has been optimized. Residency should ideally be 90% or more in the highest C- or P-state while the system is idle.
The Device Stats tab provides similar information to Overview but only for devices.
The Tunables tab contains suggestions for optimizing the system for lower power consumption. Use the up and down keys to move through suggestions and the enter key to toggle the suggestion on and off.
You can also generate HTML reports by running PowerTOP with the --html option. Replace the htmlfile.html parameter with the desired name for the output file:
powertop --html=htmlfile.html
By default PowerTOP takes measurements in 20 seconds intervals, you can change it with the --time option:
powertop --html=htmlfile.html --time=seconds