Fedora 20
Managing power consumption on Fedora
Edition 1
Rüdiger Landmann
Red Hat Engineering Content Services
Don Domingo
Red Hat Engineering Content Services
Legal Notice
Copyright © 2014 Red Hat, Inc. and others.
The text of and illustrations in this document are licensed by Red Hat under a Creative Commons Attribution–Share Alike 3.0 Unported license ("CC-BY-SA"). An explanation of CC-BY-SA is available at
http://creativecommons.org/licenses/by-sa/3.0/. The original authors of this document, and Red Hat, designate the Fedora Project as the "Attribution Party" for purposes of CC-BY-SA. In accordance with CC-BY-SA, if you distribute this document or an adaptation of it, you must provide the URL for the original version.
Red Hat, as the licensor of this document, waives the right to enforce, and agrees not to assert, Section 4d of CC-BY-SA to the fullest extent permitted by applicable law.
Red Hat, Red Hat Enterprise Linux, the Shadowman logo, JBoss, MetaMatrix, Fedora, the Infinity Logo, and RHCE are trademarks of Red Hat, Inc., registered in the United States and other countries.
Linux® is the registered trademark of Linus Torvalds in the United States and other countries.
Java® is a registered trademark of Oracle and/or its affiliates.
XFS® is a trademark of Silicon Graphics International Corp. or its subsidiaries in the United States and/or other countries.
MySQL® is a registered trademark of MySQL AB in the United States, the European Union and other countries.
All other trademarks are the property of their respective owners.
Abstract
The Power Management Guide documents how to manage power consumption on Fedora 20 systems effectively. It discusses different techniques that lower power consumption for both server and laptop, and explains how each technique affects the overall performance of your system.
Power management has been one of the focus points for improvements for Fedora 20. This document provides guidance and information regarding power management for systems running Fedora 20.
1.1. Importance of Power Management
Power management is about studying the different tasks your system performs and configuring each component to effectively optimize its energy consumption while keeping its performance. Correct use of power management results in:
reduced overall energy consumption and reduced electricity costs
reduced heat for servers and computing centers
reduced secondary costs, including cooling, space, cables, generators, and uninterruptible power supplies (UPS)
extended battery life for laptops
lower carbon dioxide output
meeting government regulations or legal requirements such as
Energy Star
meeting company guidelines for new systems
Lowering the power consumption of your whole system or of a specific component leads to lowering their performance. As such, you should thoroughly study and test the decrease in performance you can afford for your configurations, especially on mission-critical systems.
By studying the different tasks that your system performs, and configuring each component to ensure its performance is sufficient for the job, you can save energy, generate less heat, and optimize battery life for laptops. Many of the principles for analysis and tuning of a system in regard to power consumption are similar to those for performance tuning. To some degree, power management and performance tuning are opposite approaches to system configuration, because systems are usually optimized either towards performance or power consumption. This guide describes the tools and techniques that the Fedora Project provides for lowering power consumption.
A lot of new power management features have been introduced to Fedora 20 that are enabled by default. They are all selectively chosen to not impact the performance of a typical server or desktop use case. However, for very specific use cases where maximum throughput, lowest latency, or highest CPU performance is absolutely required, a review of those defaults might be necessary.
To decide whether you should optimize your machines using the techniques described in this document, consider the following questions:
- Must I optimize?
The importance of power optimization depends on whether your company has guidelines that need to be followed or if there are any regulations that you have to fulfill.
- How much do I need to optimize?
Several of the techniques present in this guide do not require you to go through the whole process of auditing and analyzing your machine in detail but instead offer a set of general optimizations that typically improve power usage. Those will typically not be as good as a manually audited and optimized system, but provide a good compromise.
- Will optimization reduce system performance to an unacceptable level?
Most of the techniques described in this document impact the performance of your system noticeably. If you choose to implement power management beyond the defaults already in place in Fedora 20, you should monitor the performance of the system after power optimization and decide if the performance loss is acceptable.
- Will the time and resources spent to optimize the system outweigh the gains achieved?
Optimizing a single system manually, following the whole process is typically not worth it as the time and cost spent doing so is far higher than the typical benefit you would get over the lifetime of a single machine. On the other hand, if you are deploying 10000 desktop systems to your offices all using the same configuration and setup, then creating one optimized setup and applying that to all 10000 machines is a good idea.
1.2. Power Management Basics
Effective power management is built on the following principles:
An idle CPU should only wake up when needed
The kernel used in releases of Fedora prior to Fedora 18 used a periodic timer for each CPU. This timer prevents the CPU from truly going idle, as it requires the CPU to process each timer event (which would happen every few milliseconds, depending on the setting), regardless of whether any process was running or not. A large part of effective power management involves reducing the frequency at which CPU wakeups are made.
Because of this, the Linux kernel in Fedora 20 eliminates the periodic timer: as a result, the idle state of a CPU is now tickless. This prevents the CPU from consuming unnecessary power when it is idle. However, benefits from this feature can be offset if your system has applications that create unnecessary timer events. Polling events (such as checks for volume changes, mouse movement, and the like) are examples of such events.
Unused hardware and devices should be disabled completely
This is especially true for devices that have moving parts (for example, hard disks). In addition to this, some applications may leave an unused but enabled device "open"; when this occurs, the kernel assumes that the device is in use, which can prevent the device from going into a power saving state.
Low activity should translate to low wattage
In many cases, however, this depends on modern hardware and correct BIOS configuration. Older system components often do not have support for some of the new features that we now can support in Fedora 20. Make sure that you are using the latest official firmware for your systems and that in the power management or device configuration sections of the BIOS the power management features are enabled. Some features to look for include:
SpeedStep
PowerNow!
Cool'n'Quiet
ACPI (C state)
Smart
If your hardware has support for these features and they are enabled in the BIOS, Fedora 20 will use them by default.
Different forms of CPU states and their effects
Modern CPUs together with
Advanced Configuration and Power Interface (ACPI) provide different power states. The three different states are:
A CPU running on the lowest sleep state possible (indicated by the highest C-state number) consumes the least amount of watts, but it also takes considerably more time to wake it up from that state when needed. In very rare cases this can lead to the CPU having to wake up immediately every time it just went to sleep. This situation results in an effectively permanently busy CPU and loses some of the potential power saving if another state had been used.
A turned off machine uses the least amount of power
As obvious as this might sound, one of the best ways to actually save power is to turn off systems. For example, your company can develop a corporate culture focused on "green IT" awareness with a guideline to turn of machines during lunch break or when going home. You also might consolidate several physical servers into one bigger server and virtualize them using the virtualization technology we ship with Fedora 20.
Chapter 2. Power Management Auditing and Analysis
2.1. Audit and Analysis Overview
The detailed manual audit, analysis, and tuning of a single system is usually the exception because the time and cost spent to do so typically outweighs the benefits gained from these last pieces of system tuning. However, performing these tasks once for a large number of nearly identical systems where you can reuse the same settings for all systems can be very useful. For example, consider the deployment of thousands of desktop systems, or a HPC cluster where the machines are nearly identical. Another reason to do auditing and analysis is to provide a basis for comparison against which you can identify regressions or changes in system behavior in the future. The results of this analysis can be very helpful in cases where hardware, BIOS, or software updates happen regularly and you want to avoid any surprises with regard to power consumption. Generally, a thorough audit and analysis gives you a much better idea of what is really happening on a particular system.
Auditing and analyzing a system with regard to power consumption is relatively hard, even with the most modern systems available. Most systems do not provide the necessary means to measure power use via software. Exceptions exist though: the ILO management console of Hewlett Packard server systems has a power management module that you can access through the web. IBM provides a similar solution in their BladeCenter power management module. On some Dell systems, the IT Assistant offers power monitoring capabilities as well. Other vendors are likely to offer similar capabilities for their server platforms, but as can be seen there is no single solution available that is supported by all vendors. If your system has no inbuilt mechanism to measure power consumption, a few other choices exist. You could install a special power supply for your system that offers power consumption information through USB. The Gigabyte
Odin GT 550 W PC power supply is one such example, and software to read out those values under Linux is available externally from
http://mgmt.sth.sze.hu/~andras/dev/gopsu/. As a last resort, some external watt meters like the
Watts up? PRO have a USB connector.
Direct measurements of power consumption is often only necessary to maximize savings as far as possible. Fortunately, other means are available to measure if changes are in effect or how the system is behaving. This chapter describes the necessary tools.
The tickless kernel in Fedora allows the CPU to enter the idle state more frequently, reducing power consumption and improving power management. The new
PowerTOP tool identifies specific components of kernel and user-space applications that frequently wake up the CPU.
PowerTOP was used in development to perform the audits described in
Section 3.13, “Optimizations in User Space” that led to many applications being tuned in this release, reducing unnecessary CPU wake up by a factor of ten.
Fedora 20 comes with version 2.x of
PowerTOP. This version is a complete rewrite of the 1.x code base. It features a clearer tab-based user interface and extensively uses the kernel "perf" infrastructure to give more accurate data. The power behavior of system devices is tracked and prominently displayed, so problems can be pinpointed quickly. More experimentally, the 2.x codebase includes a power estimation engine that can indicate how much power individual devices and processes are consuming. Refer to
Figure 2.1, “PowerTOP in Operation”.
Install PowerTOP with the command:
yum install powertop
PowerTOP can provide an estimate of the total power usage of the system and show individual power usage for each process, device, kernel work, timer, and interrupt handler. Laptops should run on battery power during this task. To calibrate the power estimation engine, run the following command as root:
powertop --calibrate
Calibration takes time. The process performs various tests, and will cycle through brightness levels and switch devices on and off. Do not touch the machine during the calibration. When the calibration process finishes, PowerTOP starts as normal. Let it run for approximately an hour to collect data. When enough data is collected, power estimation figures will begin appearing in the first column.
You can run PowerTOP with the following command as root:
powertop
If you are executing the command on a laptop, it should still be running on battery power so that all available data will be presented.
While it runs,
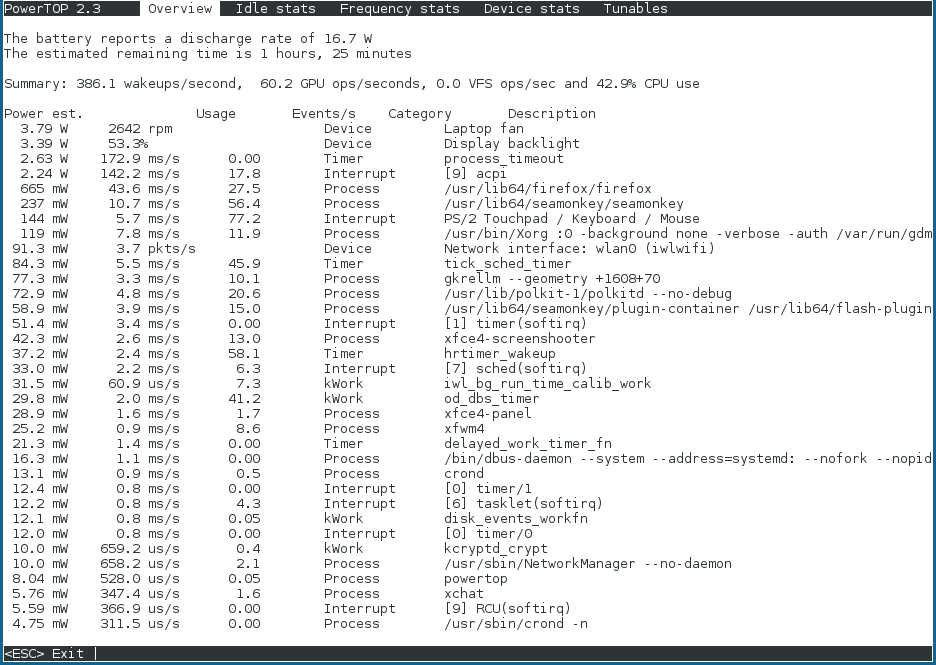
PowerTOP gathers statistics from the system. In the
Overview tab, you can view a list of the components that are either sending wake-ups to the CPU most frequently or are consuming the most power (refer to
Figure 2.1, “PowerTOP in Operation”). The adjacent columns display power estimation, how the resource is being used, wakeups per second, the classification of the component (such as process, device, or timer), and a description of the component. Wakeups per second indicates how efficiently the services or the devices and drivers of the kernel are performing. Less wakeups means less power is consumed. Components are ordered by how much further their power usage can be optimized.
Tuning driver components typically requires kernel changes, which is beyond the scope of this document. However, userland processes that send wakeups are more easily managed. First, determine whether this service or application needs to run at all on this system. If not, simply deactivate it. To turn off an old SYSV service permanently, run:
systemctl disable servicename.service
For more details about the the process, run:
ps -awux | grep processname
strace -p processid
If the trace looks like it is repeating itself, then you probably have found a busy loop. Fixing such bugs typically requires a code change in that component, which again goes beyond the scope of this document. Please report such issues into the Bugzilla.
As seen in
Figure 2.1, “PowerTOP in Operation”, total power consumption and the remaining battery life are displayed, if applicable. Below these is a short summary, featuring total wakeups per second, GPU operations per second, and virtual filesystem operations per second. In the rest of the screen there is a list of processes, interrupts, devices and other resources sorted according their utilization. If properly calibrated, a power consumption estimation for every listed item in the first column is shown as well.
Use the Tab and Shift+Tab keys to cycle through tabs. In the Idle stats tab, use of C-states is shown for all processors and cores. In the Frequency stats tab, use of P-states including the Turbo mode (if applicable) is shown for all processors and cores. The longer the CPU stays in the higher C- or P-states, the better (C4 being higher than C3). This is a good indication of how well CPU usage has been optimized. Residency should ideally be 90% or more in the highest C- or P-state while the system is idle.
The Device Stats tab provides similar information to Overview but only for devices.
The Tunables tab contains suggestions for optimizing the system for lower power consumption. Use the up and down keys to move through suggestions and the enter key to toggle the suggestion on and off.
You can also generate HTML reports by running PowerTOP with the --html option. Replace the htmlfile.html parameter with the desired name for the output file:
powertop --html=htmlfile.html
By default PowerTOP takes measurements in 20 seconds intervals, you can change it with the --time option:
powertop --html=htmlfile.html --time=seconds
2.3. Diskdevstat and netdevstat
Diskdevstat and
netdevstat are
SystemTap tools that collect detailed information about the disk activity and network activity of all applications running on a system. These tools were inspired by
PowerTOP, which shows the number of CPU wakeups by every application per second (refer to
Section 2.2, “PowerTOP”). The statistics that these tools collect allow you to identify applications that waste power with many small I/O operations rather than fewer, larger operations. Other monitoring tools that measure only transfer speeds do not help to identify this type of usage.
First, install
kernel-debuginfo with the following command:
debuginfo-install kernel
Then install the tools with SystemTap:
yum install systemtap tuned-utils-systemtap
Run the tools with the command:
diskdevstat
or the command:
netdevstat
Both commands can take up to three parameters, as follows:
diskdevstat update_interval total_duration display_histogram
netdevstat update_interval total_duration display_histogram
- update_interval
The time in seconds between updates of the display. Default: 5
- total_duration
The time in seconds for the whole run. Default: 86400 (1 day)
- display_histogram
Flag whether to histogram for all the collected data at the end of the run.
The output resembles that of PowerTOP. Here is sample output from a longer diskdevstat run on a Fedora 10 system running KDE 4.2:
  PID   UID DEV     WRITE_CNT WRITE_MIN WRITE_MAX WRITE_AVG    READ_CNT  READ_MIN  READ_MAX  READ_AVG COMMAND
 2789  2903 sda1          854     0.000   120.000    39.836           0     0.000     0.000     0.000 plasma
15494     0 sda1            0     0.000     0.000     0.000         758     0.000     0.012     0.000 0logwatch
15520     0 sda1            0     0.000     0.000     0.000         140     0.000     0.009     0.000 perl
15549     0 sda1            0     0.000     0.000     0.000         140     0.000     0.009     0.000 perl
15585     0 sda1            0     0.000     0.000     0.000         108     0.001     0.002     0.000 perl
 2573     0 sda1           63     0.033  3600.015   515.226           0     0.000     0.000     0.000 auditd
15429     0 sda1            0     0.000     0.000     0.000          62     0.009     0.009     0.000 crond
15379     0 sda1            0     0.000     0.000     0.000          62     0.008     0.008     0.000 crond
15473     0 sda1            0     0.000     0.000     0.000          62     0.008     0.008     0.000 crond
15415     0 sda1            0     0.000     0.000     0.000          62     0.008     0.008     0.000 crond
15433     0 sda1            0     0.000     0.000     0.000          62     0.008     0.008     0.000 crond
15425     0 sda1            0     0.000     0.000     0.000          62     0.007     0.007     0.000 crond
15375     0 sda1            0     0.000     0.000     0.000          62     0.008     0.008     0.000 crond
15477     0 sda1            0     0.000     0.000     0.000          62     0.007     0.007     0.000 crond
15469     0 sda1            0     0.000     0.000     0.000          62     0.007     0.007     0.000 crond
15419     0 sda1            0     0.000     0.000     0.000          62     0.008     0.008     0.000 crond
15481     0 sda1            0     0.000     0.000     0.000          61     0.000     0.001     0.000 crond
15355     0 sda1            0     0.000     0.000     0.000          37     0.000     0.014     0.001 laptop_mode
 2153     0 sda1           26     0.003  3600.029  1290.730           0     0.000     0.000     0.000 rsyslogd
15575     0 sda1            0     0.000     0.000     0.000          16     0.000     0.000     0.000 cat
15581     0 sda1            0     0.000     0.000     0.000          12     0.001     0.002     0.000 perl
15582     0 sda1            0     0.000     0.000     0.000          12     0.001     0.002     0.000 perl
15579     0 sda1            0     0.000     0.000     0.000          12     0.000     0.001     0.000 perl
15580     0 sda1            0     0.000     0.000     0.000          12     0.001     0.001     0.000 perl
15354     0 sda1            0     0.000     0.000     0.000          12     0.000     0.170     0.014 sh
15584     0 sda1            0     0.000     0.000     0.000          12     0.001     0.002     0.000 perl
15548     0 sda1            0     0.000     0.000     0.000          12     0.001     0.014     0.001 perl
15577     0 sda1            0     0.000     0.000     0.000          12     0.001     0.003     0.000 perl
15519     0 sda1            0     0.000     0.000     0.000          12     0.001     0.005     0.000 perl
15578     0 sda1            0     0.000     0.000     0.000          12     0.001     0.001     0.000 perl
15583     0 sda1            0     0.000     0.000     0.000          12     0.001     0.001     0.000 perl
15547     0 sda1            0     0.000     0.000     0.000          11     0.000     0.002     0.000 perl
15576     0 sda1            0     0.000     0.000     0.000          11     0.001     0.001     0.000 perl
15518     0 sda1            0     0.000     0.000     0.000          11     0.000     0.001     0.000 perl
15354     0 sda1            0     0.000     0.000     0.000          10     0.053     0.053     0.005 lm_lid.sh
The columns are:
- PID
the process ID of the application
- UID
the user ID under which the applications is running
- DEV
the device on which the I/O took place
- WRITE_CNT
the total number of write operations
- WRITE_MIN
the lowest time taken for two consecutive writes (in seconds)
- WRITE_MAX
the greatest time taken for two consecutive writes (in seconds)
- WRITE_AVG
the average time taken for two consecutive writes (in seconds)
- READ_CNT
the total number of read operations
- READ_MIN
the lowest time taken for two consecutive reads (in seconds)
- READ_MAX
the greatest time taken for two consecutive reads (in seconds)
- READ_AVG
the average time taken for two consecutive reads (in seconds)
- COMMAND
the name of the process
In this example, three very obvious applications stand out:
  PID   UID DEV     WRITE_CNT WRITE_MIN WRITE_MAX WRITE_AVG    READ_CNT  READ_MIN  READ_MAX  READ_AVG COMMAND
 2789  2903 sda1          854     0.000   120.000    39.836           0     0.000     0.000     0.000 plasma
 2573     0 sda1           63     0.033  3600.015   515.226           0     0.000     0.000     0.000 auditd
 2153     0 sda1           26     0.003  3600.029  1290.730           0     0.000     0.000     0.000 rsyslogd
These three applications have a WRITE_CNT greater than 0, which means that they performed some form of write during the measurement. Of those, plasma was the worst offender by a large degree: it performed the most write operations, and of course the average time between writes was the lowest. Plasma would therefore be the best candidate to investigate if you were concerned about power-inefficient applications.
Use the strace and ltrace commands to examine applications more closely by tracing all system calls of the given process ID. In the present example, you could run:
strace -p 2789
In this example, the output of the strace contained a repeating pattern every 45 seconds that opened the KDE icon cache file of the user for writing followed by an immediate close of the file again. This led to a necessary physical write to the hard disk as the file metadata (specifically, the modification time) had changed. The final fix was to prevent those unnecessary calls when no updates to the icons had occurred.
2.4. Battery Life Tool Kit
The
Battery Life Tool Kit (
BLTK), is a test suite that simulates and analyzes battery life and performance.
BLTK achieves this by performing sets of tasks that simulate specific user groups and reporting on the results. Although developed specifically to test notebook performance,
BLTK can also report on the performance of desktop computers when started with the
-a.
BLTK allows you to generate very reproducible workloads that are comparable to real use of a machine. For example, the office workload writes a text, corrects things in it, and does the same for a spreadsheet. Running BLTK combined with PowerTOP or any of the other auditing or analysis tool allows you to test if the optimizations you performed have an effect when the machine is actively in use instead of only idling. Because you can run the exact same workload multiple times for different settings, you can compare results for different settings.
Install
BLTK with the command:
yum install bltk
Run
BLTK with the command:
bltk workload options
For example, to run the idle workload for 120 seconds:
bltk -I -T 120
The workloads available by default are:
-I, --idle
system is idle, to use as a baseline for comparison with other workloads
-R, --reader
simulates reading documents (by default, with Firefox)
-P, --player
simulates watching multimedia files from a CD or DVD drive (by default, with mplayer)
-O, --office
simulates editing documents with the OpenOffice.org suite
Other options allow you to specify:
-a, --ac-ignore
ignore whether AC power is available (necessary for desktop use)
-T number_of_seconds, --time number_of_seconds
the time (in seconds) over which to run the test; use this option with the idle workload
-F filename, --file filename
specifies a file to be used by a particular workload, for example, a file for the player workload to play instead of accessing the CD or DVD drive
-W application, --prog application
specifies an application to be used by a particular workload, for example, a browser other than Firefox for the reader workload
BLTK supports a large number of more specialized options. For details, refer to the
bltk man page.
BLTK saves the results that it generates in a directory specified in the
/etc/bltk.conf configuration file — by default,
~/.bltk/workload.results.number/. For example, the
~/.bltk/reader.results.002/ directory holds the results of the third test with the
reader workload (the first test is not numbered). The results are spread across several text files. To condense these results into a format that is easy to read, run:
bltk_report path_to_results_directory
The results now appear in a text file named Report in the results directory. To view the results in a terminal emulator instead, use the -o option:
bltk_report -o path_to_results_directory
Tuned is a daemon that uses udev to monitor connected devices and statically and dynamically tunes system settings according to a selected profile. It is distributed with a number of predefined profiles for common use cases like high throughput, low latency, or powersave, and allows you to further alter the rules defined for each profile and customize how to tune a particular device. To revert all changes made to the system settings by a certain profile, you can either switch to another profile or deactivate the tuned daemon.
The static tuning mainly consists of the application of predefined sysctl and sysfs settings and one-shot activation of several configuration tools like ethtool. Tuned also monitors the use of system components and tunes system settings dynamically based on that monitoring information. Dynamic tuning accounts for the way that various system components are used differently throughout the uptime for any given system. For example, the hard drive is used heavily during startup and login, but is barely used later when the user might mainly work with applications such as web browsers or email clients. Similarly, the CPU and network devices are used differently at different times. Tuned monitors the activity of these components and reacts to the changes in their use.
As a practical example, consider a typical office workstation. Most of the time, the Ethernet network interface will be very inactive. Only a few emails will go in and out every once in a while or some web pages might be loaded. For those kinds of loads, the network interface does not have to run at full speed all the time, as it does by default. Tuned has a monitoring and tuning plugin for network devices that can detect this low activity and then automatically lower the speed of that interface, typically resulting in a lower power usage. If the activity on the interface increases for a longer period of time, for example because a DVD image is being downloaded or an email with a large attachment is opened, tuned detects this and sets the interface speed to maximum to offer the best performance while the activity level is so high. This principle is used for other plugins for CPU and hard disks as well.
In general, tuned uses two types of plugins: monitoring plugins and tuning plugins. Monitoring plugins are used to get information from a running system. Currently, the following monitoring plugins are implemented:
disk
Gets disk load (number of IO operations) per device and measurement interval.
net
Gets network load (number of transferred packets) per network card and measurement interval.
load
Gets CPU load per CPU and measurement interval.
The output of the monitoring plugins can be used by tuning plugins for dynamic tuning. Currently implemented dynamic tuning algorithms try to balance the performance and powersave and are therefore disabled in the performance profiles (dynamic tuning for individual plugins can be enabled or disabled in the tuned profiles). Monitoring plugins are automatically instantiated whenever their metrics are needed by any of the enabled tuning plugins. If two tuning plugins require the same data, only one instance of the monitoring plugin is created and the data is shared.
Each tuning plugin tunes an individual subsystem and takes several parameters that are populated from the
tuned profiles. Each subsystem can have multiple devices (for example, multiple CPUs or network cards) that are handled by individual instances of the tuning plugins. Specific settings for individual devices are also supported. The supplied profiles use wildcards to match all devices of individual subsystems (for details on how to change this, refer to
Section 2.5.4, “Custom Profiles”), which allows the plugins to tune these subsystems according to the required goal (selected profile) and the only thing that the user needs to do is to select the correct
tuned profile (for details on how to select a profile or for a list of supplied profiles, see
Section 2.5.3, “Installation and Usage”). Currently, the following tuning plugins are implemented (only some of these plugins implement dynamic tuning, parameters supported by plugins are also listed):
cpu
Sets the CPU governor to the value specified by the governor parameter and dynamically changes the PM QoS CPU DMA latency according to the CPU load. If the CPU load is lower than the value specified by the load_threshold parameter, the latency is set to the value specified by the latency_high parameter, otherwise it is set to value specified by latency_low. Also the latency can be forced to a specific value without being dynamically changed further. This can be accomplished by setting the force_latency parameter to the required latency value.
eeepc_she
Dynamically sets the FSB speed according to the CPU load; this feature can be found on some netbooks and is also known as the Asus Super Hybrid Engine. If the CPU load is lower or equal to the value specified by the load_threshold_powersave parameter, the plugin sets the FSB speed to the value specified by the she_powersave parameter (for details about the FSB frequencies and corresponding values, see the kernel documentation, the provided defaults should work for most users). If the CPU load is higher or equal to the value specified by the load_threshold_normal parameter, it sets the FSB speed to the value specified by the she_normal parameter. Static tuning is not supported and the plugin is transparently disabled if the hardware support for this feature is not detected.
net
Configures wake-on-lan to the values specified by the wake_on_lan parameter (it uses same syntax as the ethtool utility). It also dynamically changes the interface speed according to the interface utilization.
sysctl
Sets various sysctl settings specified by the plugin parameters. The syntax is name=value, where name is the same as the name provided by the sysctl tool. Use this plugin if you need to change settings that are not covered by other plugins (but prefer specific plugins if the settings are covered by them).
usb
Sets autosuspend timeout of USB devices to the value specified by the autosuspend parameter. The value 0 means that autosuspend is disabled.
vm
Enables or disables transparent huge pages depending on the Boolean value of the transparent_hugepages parameter.
audio
Sets the autosuspend timeout for audio codecs to the value specified by the timeout parameter. Currently snd_hda_intel and snd_ac97_codec are supported. The value 0 means that the autosuspend is disabled. You can also enforce the controller reset by setting the Boolean parameter reset_controller to true.
disk
Sets the elevator to the value specified by the
elevator parameter. It also sets ALPM to the value specified by the
alpm parameter (refer to
Section 3.8, “Aggressive Link Power Management”), ASPM to the value specified by the
aspm parameter (refer to
Section 3.7, “Active-State Power Management”), scheduler quantum to the value specified by the
scheduler_quantum parameter, disk spindown timeout to the value specified by the
spindown parameter, disk readahead to the value specified by the
readahead parameter, and can multiply the current disk readahead value by the constant specified by the
readahead_multiply parameter. In addition, this plugin dynamically changes the advanced power management and spindown timeout setting for the drive according to the current drive utilization. The dynamic tuning can be controlled by the Boolean parameter
dynamic and is enabled by default.
mounts
Enables or disables barriers for mounts according to the Boolean value of the disable_barriers parameter.
script
This plugin can be used for the execution of an external script that is run when the profile is loaded or unloaded. The script is called by one argument which can be start or stop (it depends on whether the script is called during the profile load or unload). The script file name can be specified by the script parameter. Note that you need to correctly implement the stop action in your script and revert all setting you changed during the start action, otherwise the roll-back will not work. For your convenience, the functions Bash helper script is installed by default and allows you to import and use various functions defined in it. Note that this functionality is provided mainly for backwards compatibility and it is recommended that you use it as the last resort and prefer other plugins if they cover the required settings.
sysfs
Sets various sysfs settings specified by the plugin parameters. The syntax is name=value, where name is the sysfs path to use. Use this plugin in case you need to change some settings that are not covered by other plugins (please prefer specific plugins if they cover the required settings).
video
Sets various powersave levels on video cards (currently only the Radeon cards are supported). The powersave level can be specified by using the
radeon_powersave parameter. Supported values are:
default,
auto,
low,
mid,
high, and
dynpm. For details, refer to
http://www.x.org/wiki/RadeonFeature#KMS_Power_Management_Options. Note that this plugin is experimental and the parameter may change in the future releases.
2.5.2. Provided Profiles
The following is a list of profiles which are installed with the base package:
balanced
The default power-saving profile. It is intended to be a comprimise between performance and power consumption. It tries to use auto-scaling and auto-tunning whenever possible. It has good results for most loads. The only drawback is the increased latency. In the current tuned release it enables the CPU, disk, audio and video plugins and activates the ondemand governor. The radeon_powersave is set to auto.
powersave
A profile for maximum power saving performance. It can throttle the performance in order to minimize the actual power consumption. In the current
tuned release it enables USB autosuspend, WiFi power saving and ALPM power savings for SATA host adapters (refer to
Section 3.8, “Aggressive Link Power Management”). It also schedules multi-core power savings for systems with a low wakeup rate and activates the
ondemand governor. It enables AC97 audio power saving or, depending on your system, HDA-Intel power savings with a 10 seconds timeout. In case your system contains supported Radeon graphics card with enabled KMS it configures it to automatic power saving. On Asus Eee PCs a dynamic Super Hybrid Engine is enabled.
The powersave profile may not always be the most efficient. Consider there is a defined amount of work that needs to be done, for example a video file that needs to be transcoded. Your machine can consume less energy if the transcoding is done on the full power, because the task will be finished quickly, the machine will start to idle and can automatically step-down to very efficient power save modes. On the other hand if you transcode the file with a throttled machine, the machine will consume less power during the transcoding, but the process will take longer and the overall consumed energy can be higher. That is why the balanced profile can be generally a better option.
throughput-performance
A server profile optimized for high throughput. It disables power savings mechanisms and enables sysctl settings that improve the throughput performance of the disk, network IO and switched to the deadline scheduler. CPU governor is set to performance.
latency-performance
A server profile optimized for low latency. It disables power savings mechanisms and enables sysctl settings that improve the latency. CPU governor is set to performance and the CPU is locked to the low C states (by PM QoS).
virtual-guest
A profile designed for virtual guests based on the enterprise-storage profile that, among other tasks, decreases virtual memory swappiness and increases disk readahead values. It does not disable disk barriers.
virtual-host
A profile designed for virtual hosts based on the enterprise-storage profile that, among other tasks, decreases virtual memory swappiness, increases disk readahead values and enables more aggresive writeback of dirty pages.
Additional predefined profiles are available by installing the tuned-profiles-compat package. These profiles are intended for backward compatibility and are no longer developed. The generalized profiles from the base package will mostly perform the same or better. If you do not have specific reason for using them, please prefer the above mentioned profiles from the base package. The compat profiles are following:
default
This has the lowest impact on power saving of the available profiles and only enables CPU and disk plugins of tuned.
desktop-powersaveserver-powersave
A power-saving profile directed at server systems. Enables ALPM powersaving for SATA host adapters and activates the CPU and disk plugins of tuned.
laptop-ac-powersave
A medium-impact power-saving profile directed at laptops running on AC. Enables ALPM powersaving for SATA host adapters, Wi-Fi power saving, as well as the CPU, Ethernet, and disk plugins of tuned.
laptop-battery-powersave
A high-impact power-saving profile directed at laptops running on battery. In the current tuned implementation it is an alias for the powersave profile.
spindown-disk
A power-saving profile for machines with classic HDDs to maximize spindown time. It disables the tuned power savings mechanism, disables USB autosuspend, disables Bluetooth, enables Wi-Fi power saving, disables logs syncing, increases disk write-back time, and lowers disk swappiness. All partitions are remounted with the noatime option.
enterprise-storage
A server profile directed at enterprise-class storage, maximizing I/O throughput. It activates the same settings as the throughput-performance profile, multiplies readahead settings, and disables barriers on non-root and non-boot partitions.
For more information on the Tuned profiles, refer to the tuned-adm(8) manual page.
2.5.3. Installation and Usage
To install the tuned package, run, as root, the following command:
yum install tuned
Installation of the
tuned package also presets the profile which should be the best for you system. Currently the default profile is selected according the following customizable rules:
throughput-performance
This is pre-selected on Fedora operating systems which act as compute nodes. The goal on such systems is the best throughput performance.
virtual-guest
This is pre-selected on virtual machines. The goal is best performance. If you are not interested in best performance, you would probably like to change it to the balanced or powersave profile (see bellow).
balanced
This is pre-selected in all other cases. The goal is balanced performance and power consumption.
To start tuned, run, as root, the following command:
systemctl start tuned
To enable tuned to start every time the machine boots, type the following command:
systemctl enable tuned
For other
tuned control such as selection of profiles and other, use:
tuned-adm
This command requires the tuned service to be running.
To view the available installed profiles, run:
tuned-adm list
To view the currently activated profile, run:
tuned-adm active
To select or activate a profile, run:
tuned-adm profile profile
For example:
tuned-adm profile powersave
As an experimental feature it is possible to select more profiles at once. The tuned application will try to merge them during the load. If there are conflicts the settings from the last specified profile will take precedence. This is done automatically and there is no checking whether the resulting combination of parameters makes sense. If used without thinking, the feature may tune some parameters the opposite way which may be counterproductive. An example of such situation would be setting the disk for the high throughput by using the throughput-performance profile and concurrently setting the disk spindown to the low value by the spindown-disk profile. The following example optimizes the system for run in a virtual machine for the best performance and concurrently tune it for the low power consumption while the low power consumption is the priority:
tuned-adm profile virtual-guest powersave
To let tuned recommend you the best suitable profile for your system without changing any existing profiles and using the same logic as used during the installation, run the following command:
tuned-adm recommend
Tuned itself has additional options that you can use when you run it manually. However, this is not recommended and is mostly intended for debugging purposes. The available options can be viewing using the following command:
tuned --help
Distribution-specific profiles are stored in the /usr/lib/tuned directory. Each profile has its own directory. The profile consists of the main configuration file called tuned.conf and optionally other files like helper scripts. Do not change the profiles in /usr/lib/tuned. If you need to customize the profile, copy the profile directory to the /etc/tuned directory. This is the place for the custom profiles. If there are two profiles with the same name, the profile from /etc/tuned will take precedence. You can also create your own profile in the /etc/tuned directory which will include the profile of your interest and only change or override the desired parameters.
The tuned.conf file contains several sections. There is one [main] section. The other sections are configurations for plugins instances. All sections are optional including the [main] section. Comments are also supported. Lines starting with a hash (#) are comments.
The [main] section has the following option:
include=profile
The specified profile will be included, e.g. include=powersave will include the powersave profile.
Sections describing plugins instances are formatted in the following way:
[NAME]
type=TYPE
devices=DEVICES
NAME is the name of the plugin instance as it is used in the logs. It can be an arbitrary string.
TYPE is the type of the tuning plugin. For a list and descriptions of the tuning plugins refer to
Section 2.5.1, “Plugins”.
DEVICES is the list of devices this plugin instance will handle. The
devices line can contain a list, a wildcard (*), and negation (!). You can also combine rules. If there is no
devices line all devices present or later attached on the system of the
TYPE will be handled by the plugin instance. This is same as using
devices=*. If no instance of the plugin is specified, the plugin will not be enabled. If the plugin supports more options, they can be also specified in the plugin section. If the option is not specified, the default value will be used (if not previously specified in the included plugin). For the list of plugin options refer to
Section 2.5.1, “Plugins”).
Example 2.1. Describing plugins instances
The following example will match everything starting with sd, such as sda or sdb and doesn't disable barriers on them:
[data_disk]
type=disk
devices=sd*
disable_barriers=false
The following example will match everything except sda1 and sda2:
[data_disk]
type=disk
devices=!sda1, !sda2
disable_barriers=false
In cases where you do not need custom names for the plugin instance and there is only one definition of the instance in your configuration file, Tuned supports the following short syntax:
[TYPE]
devices=DEVICES
In this case, it is possible to omit the type line. The instance will then be referred to with a name, same as the type. The previous example could be then rewritten into:
[disk]
devices=sdb*
disable_barriers=false
If the same section is specified more than once using the include option, then the settings are merged. If they cannot be merged due to a conflict, the last conflicting definition will override the previous settings in conflict. Sometimes you do not know what was previously defined. In such cases, you can use the replace boolean option and set it to true. This will cause all the previous definitions with the same name to be overwritten and the merge will not happen.
You can also disable the plugin by specifying the enabled=false option. This has the same effect as if the instance was never defined. Disabling the plugin can be useful if you are redefining the previous definition from the include option and do not want the plugin to be active in your custom profile.
Most of the time the device can be handled by one plugin instance. If the device matches multiple instances definitions, an error is reported.
The following is an example of a custom profile that is based on the balanced profile and extends it the way that ALPM for all devices is set to the maximal powersave.
[main]
include=balanced

[disk]
alpm=min_power
The
powertop2tuned utility is a tool that allows you to create custom
tuned profiles from the
PowerTOP suggestions. For details about
PowerTOP refer to
Section 2.2, “PowerTOP”).
To install the powertop2tuned application, run, as root, the following command:
yum install tuned-utils
To create a custom profile, run , as root, the following command:
powertop2tuned new_profile_name
By default it creates the profile in the /etc/tuned directory and it bases it on the currently selected tuned profile. For safety reasons all PowerTOP tunings are initially disabled in the new profile. To enable them uncomment the tunings of your interest in the /etc/tuned/profile/tuned.conf. You can use the --enable or -e option that will generate the new profile with most of the tunings suggested by PowerTOP enabled. Some dangerous tunings like the USB autosuspend will still be disabled. If you really need them you will have to uncomment them manually. By defautl, the new profile is not activated. To activate it run the following command:
tuned-adm profile new_profile_name
For a complete list of powertop2tuned options, type in the following command:
powertop2tuned --help
In Fedora 11
DeviceKit-power assumed the power management functions that were part of
HAL and some of the functions that were part of
GNOME Power Manager in previous releases of Fedora (refer also to
Section 2.7, “GNOME Power Manager”. In Fedora 13,
DeviceKit-power was renamed to
UPower.
UPower provides a daemon, an API, and a set of command-line tools. Each power source on the system is represented as a device, whether it is a physical device or not. For example, a laptop battery and an AC power source are both represented as devices.
You can access the command-line tools with the upower command and the following options:
--enumerate, -e
displays an object path for each power devices on the system, for example:
/org/freedesktop/UPower/devices/line_power_AC
/org/freedesktop/UPower/devices/battery_BAT0
--dump, -d
displays the parameters for all power devices on the system.
--wakeups, -w
displays the CPU wakeups on the system.
--monitor, -m
monitors the system for changes to power devices, for example, the connection or disconnection of a source of AC power, or the depletion of a battery. Press Ctrl+C to stop monitoring the system.
--monitor-detail
monitors the system for changes to power devices, for example, the connection or disconnection of a source of AC power, or the depletion of a battery. The --monitor-detail option presents more detail than the --monitor option. Press Ctrl+C to stop monitoring the system.
--show-info object_path, -i object_path
displays all information available for a particular object path. For example, to obtain information about a battery on your system represented by the object path /org/freedesktop/UPower/devices/battery_BAT0, run:
upower -i /org/freedesktop/UPower/devices/battery_BAT0
2.7. GNOME Power Manager
GNOME Power Manager is a daemon that is installed as part of the GNOME desktop. Much of the power-management functionality that
GNOME Power Manager provided in early releases of Fedora became part of
DeviceKit-power in Fedora 11, renamed to
UPower in Fedora 13 (see
Section 2.6, “UPower”. However,
GNOME Power Manager remains a front end for that functionality. Through an applet in the system tray,
GNOME Power Manager notifies you of changes in your system's power status; for example, a change from battery to AC power. It also reports battery status, and warns you when battery power is low.
acpid is a daemon that monitors Advanced Configuration and Power Interface (ACPI) events and executes scripts to respond to them. These events are typically prompted by the user interacting with the hardware, such as closing a laptop lid or pressing the power button.
acpid executes actions based on rules you establish. Certain rules are predefined on installation but can be altered. These rules are set in configuration files created in /etc/acpi/events.
Each file must define an event and an action on separate lines for each rule. The event= line identifies the hardware interaction to be configured. The action= line specifies a shell script containing the configuration, which you must create (typically in /etc/acpi/actions). Multiple rules can be set for each event, or one rule for multiple events.
acpid ships with one shell script at /etc/acpi/actions/power.sh and two configuration files in /etc/acpi/events: powerconf and videoconf. powerconf is structured as follows:
# ACPID config to power down machine if powerbutton is pressed, but only if
# no gnome-power-manager is running

event=button/power.*
action=/etc/acpi/actions/power.sh
acpid is installed by default in some, but not all Fedora installations.
2.9. Other Tools for Auditing
Fedora 20 offers quite a few more tools with which to perform system auditing and analysis. Most of them can be used as supplementary sources of information in case you want to verify what you have discovered already or in case you need more in-depth information on certain parts. Many of these tools are used for performance tuning as well. They include:
- vmstat
vmstat gives you detailed information about processes, memory, paging, block I/O, traps, and CPU activity. Use it to take a closer look at what the system overall does and where it is busy.
- iostat
iostat is similar to vmstat, but only for I/O on block devices. It also provides more verbose output and statistics.
- blktrace
blktrace is a very detailed block I/O trace program. It breaks down information to single blocks associated with applications. It is very useful in combination with diskdevstat.
Chapter 3. Core Infrastructure and Mechanics
To use the cpupower command featured in this chapter, ensure you have the kernel-tools package installed.
CPUs with the x86 architecture support various states in which parts of the CPU are deactivated or run at lower performance settings. These states, known as C-states, allow systems to save power by partially deactivating CPUs that are not in use. C-states are numbered from C0 upwards, with higher numbers representing decreased CPU functionality and greater power saving. C-States of a given number are broadly similar across processors, although the exact details of the specific feature sets of the state may vary between processor families. C-States 0–3 are defined as follows:
- C0
the operating or running state. In this state, the CPU is working and not idle at all.
- C1, Halt
a state where the processor is not executing any instructions but is typically not in a lower power state. The CPU can continue processing with practically no delay. All processors offering C-States need to support this state. Pentium 4 processors support an enhanced C1 state called C1E that actually is a state for lower power consumption.
- C2, Stop-Clock
a state where the the clock is frozen for this processor but it keeps the complete state for its registers and caches, so after starting the clock again it can immediately start processing again. This is an optional state.
- C3, Sleep
a state where the processor really goes to sleep and does not need to keep its cache up to date. Waking up from this state takes considerably longer than from C2 due to this. Again this is an optional state.
To view available idle states and other statistics for the CPUidle driver, run the following command:
cpupower idle-info
Recent Intel CPUs with the "Nehalem" microarchitecture feature a new C-State, C6, which can reduce the voltage supply of a CPU to zero, but typically reduces power consumption by between 80% and 90%. The kernel in Fedora 20 includes optimizations for this new C-State.
3.2. Using CPUfreq Governors
One of the most effective ways to reduce power consumption and heat output on your system is to use CPUfreq. CPUfreq — also referred to as CPU speed scaling — allows the clock speed of the processor to be adjusted on the fly. This enables the system to run at a reduced clock speed to save power. The rules for shifting frequencies, whether to a faster or slower clock speed, and when to shift frequencies, are defined by the CPUfreq governor.
The governor defines the power characteristics of the system CPU, which in turn affects CPU performance. Each governor has its own unique behavior, purpose, and suitability in terms of workload. This section describes how to choose and configure a CPUfreq governor, the characteristics of each governor, and what kind of workload each governor is suitable for.
The main concerns surrounding power management are:
As a rule, lowering the power consumption of a specific component (or of the system as a whole) will lead to lower heat and naturally, performance. As such, you should thoroughly study and test the decrease in performance afforded by any configurations you make, especially for mission-critical systems.
The following sections explain how optimal hardware performance benefits your system in terms of energy consumption.
3.2.1. CPUfreq Governor Types
This section lists and describes the different types of CPUfreq governors available in Fedora 20.
cpufreq_performance
The Performance governor forces the CPU to use the highest possible clock frequency. This frequency will be statically set, and will not change. As such, this particular governor offers
no power saving benefit. It is only suitable for hours of heavy workload, and even then only during times wherein the CPU is rarely (or never) idle.
cpufreq_powersave
By contrast, the Powersave governor forces the CPU to use the lowest possible clock frequency. This frequency will be statically set, and will not change. As such, this particular governor offers maximum power savings, but at the cost of the
lowest CPU performance.
The term "powersave" can sometimes be deceiving, though, since (in principle) a slow CPU on full load consumes more power than a fast CPU that is not loaded. As such, while it may be advisable to set the CPU to use the Powersave governor during times of expected low activity, any unexpected high loads during that time can cause the system to actually consume more power.
The Powersave governor is, in simple terms, more of a "speed limiter" for the CPU than a "power saver". It is most useful in systems and environments where overheating can be a problem.
cpufreq_ondemand
The Ondemand governor is a dynamic governor that allows the CPU to achieve maximum clock frequency when system load is high, and also minimum clock frequency when the system is idle. While this allows the system to adjust power consumption accordingly with respect to system load, it does so at the expense of
latency between frequency switching. As such, latency can offset any performance/power saving benefits offered by the Ondemand governor if the system switches between idle and heavy workloads too often.
For most systems, the Ondemand governor can provide the best compromise between heat emission, power consumption, performance, and manageability. When the system is only busy at specific times of the day, the Ondemand governor will automatically switch between maximum and minimum frequency depending on the load without any further intervention.
cpufreq_userspace
The Userspace governor allows userspace programs (or any process running as root) to set the frequency. Of all the governors, Userspace is the most customizable; and depending on how it is configured, it can offer the best balance between performance and consumption for your system.
cpufreq_conservative
Like the Ondemand governor, the Conservative governor also adjusts the clock frequency according to usage (like the Ondemand governor). However, while the Ondemand governor does so in a more aggressive manner (that is from maximum to minimum and back), the Conservative governor switches between frequencies more gradually.
This means that the Conservative governor will adjust to a clock frequency that it deems fitting for the load, rather than simply choosing between maximum and minimum. While this can possibly provide significant savings in power consumption, it does so at an ever greater latency than the Ondemand governor.
You can enable a governor using cron jobs. This allows you to automatically set specific governors during specific times of the day. As such, you can specify a low-frequency governor during idle times (for example after work hours) and return to a higher-frequency governor during hours of heavy workload.
All CPUfreq drivers are built in and selected automatically, so to set up CPUfreq you just need to select a governor.
You can view which governors are available for use for a specific CPU using:
cpupower frequency-info --governors
You can then enable one of these governors on all CPUs using:
cpupower frequency-set --governor [governor]
To only enable a governor on specific cores, use -c with a range or comma-separated list of CPU numbers. For example, to enable the Userspace governor for CPUs 1-3 and 5, the command would be:
cpupower -c 1-3,5 frequency-set --governor cpufreq_userspace
3.2.3. Tuning CPUfreq Policy and Speed
Once you have chosen an appropriate CPUfreq governor, you can view CPU speed and policy information with the cpupower frequency-info command and further tune the speed of each CPU with options for cpupower frequency-set.
For cpupower frequency-info, the following options are available:
--freq — Shows the current speed of the CPU according to the CPUfreq core, in KHz.
--hwfreq — Shows the current speed of the CPU according to the hardware, in KHz (only available as root).
--driver — Shows what CPUfreq driver is used to set the frequency on this CPU.
--governors — Shows the CPUfreq governors available in this kernel. If you wish to use a CPUfreq governor that is not listed in this file, refer to
Section 3.2.2, “CPUfreq Setup” for instructions on how to do so.
--affected-cpus — Lists CPUs that require frequency coordination software.
--policy — Shows the range of the current CPUfreq policy, in KHz, and the currently active governor.
--hwlimits — Lists available frequencies for the CPU, in KHz.
For cpupower frequency-set, the following options are available:
--min <freq> and --max <freq> — Set the policy limits of the CPU, in KHz.
When setting policy limits, you should set --max before --min.
--freq <freq> — Set a specific clock speed for the CPU, in KHz. You can only set a speed within the policy limits of the CPU (as per --min and --max).
--governor <gov> — Set a new CPUfreq governor.
If you do not have the
kernel-tools package installed, CPUfreq settings can be viewed in the tunables found in
/sys/devices/system/cpu/[cpuid]/cpufreq/. Settings and values can be changed by writing to these tunables. For example, to set the minimum clock speed of cpu0 to 360 KHz, use:
echo 360000 > /sys/devices/system/cpu/cpu0/cpufreq/scaling_min_freq
cpupower features a selection of monitors that provide idle and sleep state statistics and frequency information and report on processor topology. Some monitors are processor-specific, while others are compatible with any processor. Refer to the cpupower-monitor man page for details on what each monitor measures and which systems they are compatible with.
Use the following options with the cpupower monitor command:
-l — list all monitors available on your system.
-m <monitor1>, <monitor2> — display specific monitors. Their identifiers can be found by running -l.
command — display the idle statistics and CPU demands of a specific command.
3.4. CPU Power Saving Policies
cpupower provides ways to regulate your processor's power saving policies.
Use the following options with the cpupower set command:
- --perf-bias <0-15>
Allows software on supported Intel processors to more actively contribute to determining the balance between optimum performance and saving power. This does not override other power saving policies. Assigned values range from 0 to 15, where 0 is optimum performance and 15 is optimum power efficiency.
By default, this option applies to all cores. To apply it only to individual cores, add the --cpu <cpulist> option.
- --sched-mc <0|1|2>
Restricts the use of power by system processes to the cores in one CPU package before other CPU packages are drawn from. 0 sets no restrictions, 1 initially employs only a single CPU package, and 2 does this in addition to favouring semi-idle CPU packages for handling task wakeups.
- --sched-smt <0|1|2>
Restricts the use of power by system processes to the thread siblings of one CPU core before drawing on other cores. 0 sets no restrictions, 1 initially employs only a single CPU package, and 2 does this in addition to favouring semi-idle CPU packages for handling task wakeups.
When a system is suspended, the kernel calls on drivers to store their states and then unloads them. When the system is resumed, it reloads these drivers, which attempt to reprogram their devices. The drivers' ability to accomplish this task determines whether the system can be resumed successfully.
Video drivers are particularly problematic in this regard, because the Advanced Configuration and Power Interface (ACPI) specification does not require system firmware to be able to reprogram video hardware. Therefore, unless video drivers are able to program hardware from a completely uninitialized state, they may prevent the system from resuming.
Fedora 20 includes greater support for new graphics chipsets, which ensures that suspend and resume will work on a greater number of platforms.
Previously, the Linux kernel periodically interrupted each CPU on a system at a predetermined frequency — 100 Hz, 250 Hz, or 1000 Hz, depending on the platform. The kernel queried the CPU about the processes that it was executing, and used the results for process accounting and load balancing. Known as the timer tick, the kernel performed this interrupt regardless of the power state of the CPU. Therefore, even an idle CPU was responding to up to 1000 of these requests every second. On systems that implemented power saving measures for idle CPUs, the timer tick prevented the CPU from remaining idle long enough for the system to benefit from these power savings.
The kernel in Fedora 20 runs tickless: that is, it replaces the old periodic timer interrupts with on-demand interrupts. Therefore, idle CPUs are allowed to remain idle until a new task is queued for processing, and CPUs that have entered lower power states can remain in these states longer.
3.7. Active-State Power Management
Active-State Power Management (ASPM) saves power in the Peripheral Component Interconnect Express (PCI Express or PCIe) subsystem by setting a lower power state for PCIe links when the devices to which they connect are not in use. ASPM controls the power state at both ends of the link, and saves power in the link even when the device at the end of the link is in a fully powered-on state.
When ASPM is enabled, device latency increases because of the time required to transition the link between different power states. ASPM has three policies to determine power states:
- default
sets PCIe link power states according to the defaults specified by the firmware on the system (for example, BIOS). This is the default state for ASPM.
- powersave
sets ASPM to save power wherever possible, regardless of the cost to performance.
- performance
disables ASPM to allow PCIe links to operate with maximum performance.
ASPM policies are set in /sys/module/pcie_aspm/parameters/policy, but can also be specified at boot time with the pcie_aspm kernel parameter, where pcie_aspm=off disables ASPM and pcie_aspm=force enables ASPM, even on devices that do not support ASPM.
If pcie_aspm=force is set, hardware that does not support ASPM can cause the system to stop responding. Before setting pcie_aspm=force, ensure that all PCIe hardware on the system supports ASPM.
3.8. Aggressive Link Power Management
Aggressive Link Power Management (ALPM) is a power-saving technique that helps the disk save power by setting a SATA link to the disk to a low-power setting during idle time (that is when there is no I/O). ALPM automatically sets the SATA link back to an active power state once I/O requests are queued to that link.
Power savings introduced by ALPM come at the expense of disk latency. As such, you should only use ALPM if you expect the system to experience long periods of idle I/O time.
When available, ALPM is enabled by default. ALPM has three modes:
min_power
This mode sets the link to its lowest power state (SLUMBER) when there is no I/O on the disk. This mode is useful for times when an extended period of idle time is expected.
medium_power
This mode sets the link to the second lowest power state (PARTIAL) when there is no I/O on the disk. This mode is designed to allow transitions in link power states (for example during times of intermittent heavy I/O and idle I/O) with as small impact on performance as possible.
medium_power mode allows the link to transition between PARTIAL and fully-powered (that is "ACTIVE") states, depending on the load. Note that it is not possible to transition a link directly from PARTIAL to SLUMBER and back; in this case, either power state cannot transition to the other without transitioning through the ACTIVE state first.
max_performance
ALPM is disabled; the link does not enter any low-power state when there is no I/O on the disk.
To check whether your SATA host adapters actually support ALPM you can check if the file /sys/class/scsi_host/host*/link_power_management_policy exists. To change the settings simply write the values described in this section to these files or display the files to check for the current setting.
Setting ALPM to min_power or medium_power will automatically disable the "Hot Plug" feature.
3.9. Relatime Drive Access Optimization
The POSIX standard requires that operating systems maintain file system metadata that records when each file was last accessed. This timestamp is called atime, and maintaining it requires a constant series of write operations to storage. These writes keep storage devices and their links busy and powered up. Since few applications make use of the atime data, this storage device activity wastes power. Significantly, the write to storage would occur even if the file was not read from storage, but from cache. For some time, the Linux kernel has supported a noatime option for mount and would not write atime data to file systems mounted with this option. However, simply turning off this feature is problematic because some applications rely on atime data and will fail if it is not available.
The kernel used in Fedora 20 supports another alternative — relatime. Relatime maintains atime data, but not for each time that a file is accessed. With this option enabled, atime data is written to the disk only if the file has been modified since the atime data was last updated (mtime), or if the file was last accessed more than a certain length of time ago (by default, one day).
By default, all filesystems are now mounted with relatime enabled. You can suppress it for any particular file system by mounting that file system with the option norelatime.
Fedora 20 supports the power capping features found in recent hardware, such as HP Dynamic Power Capping (DPC), and Intel Node Manager (NM) technology. Power capping allows administrators to limit the power consumed by servers, but it also allows managers to plan data centers more efficiently, because the risk of overloading existing power supplies is greatly diminished. Managers can place more servers within the same physical footprint and have confidence that if server power consumption is capped, the demand for power during heavy load will not exceed the power available.
HP Dynamic Power Capping
Dynamic Power Capping is a feature available on select ProLiant and BladeSystem servers that allows system administrators to cap the power consumption of a server or a group of servers. The cap is a definitive limit that the server will not exceed, regardless of its current workload. The cap has no effect until the server reaches its power consumption limit. At that point, a management processor adjusts CPU P-states and clock throttling to limit the power consumed.
Dynamic Power Capping modifies CPU behavior independently of the operating system, however, HP's integrated Lights-Out 2 (iLO2) firmware allows operating systems access to the management processor and therefore applications in user space can query the management processor. The kernel used in Fedora 20 includes a driver for HP iLO and iLO2 firmware, which allows programs to query management processors at /dev/hpilo/dXccbN. The kernel also includes an extension of the hwmon sysfs interface to support power capping features, and a hwmon driver for ACPI 4.0 power meters that use the sysfs interface. Together, these features allow the operating system and user-space tools to read the value configured for the power cap, together with the current power usage of the system.
Intel Node Manager
Intel Node Manager imposes a power cap on systems, using processor P-states and T-states to limit CPU performance and therefore power consumption. By setting a power management policy, administrators can configure systems to consume less power during times when system loads are low, for example, at night or on weekends.
Intel Node Manager adjusts CPU performance using Operating System-directed configuration and Power Management (OSPM) through the standard Advanced Configuration and Power Interface. When Intel Node Manager notifies the OSPM driver of changes to T-states, the driver makes corresponding changes to processor P-states. Similarly, when Intel Node Manager notifies the OSPM driver of changes to P-states, the driver changes T-states accordingly. These changes happen automatically and require no further input from the operating system. Administrators configure and monitor Intel Node Manager with Intel Data Center Manager (DCM) software.
3.11. Enhanced Graphics Power Management
Fedora 20 saves power on graphics and display devices by eliminating several sources of unnecessary consumption.
LVDS reclocking
Low-voltage differential signaling (LVDS) is a system for carrying electronic signals over copper wire. One significant application of the system is to transmit pixel information to
liquid crystal display (LCD) screens in notebook computers. All displays have a
refresh rate — the rate at which they receive fresh data from a graphics controller and redraw the image on the screen. Typically, the screen receives fresh data sixty times per second (a frequency of 60 Hz). When a screen and a graphics controller are linked by LVDS, the LVDS system uses power on every refresh cycle. When idle, the refresh rate of many LCD screens can be dropped to 30 Hz without any noticeable effect (unlike
cathode ray tube (CRT) monitors, where a decrease in refresh rate produces a characteristic flicker). The driver for Intel graphics adapters built into the kernel used in Fedora 20 performs this
down-clocking automatically, and saves around 0.5 W when the screen is idle.
Enabling memory self-refresh
Synchronous dynamic random access memory (SDRAM) — as used for video memory in graphics adapters — is recharged thousands of times per second so that individual memory cells retain the data that is stored in them. Apart from its main function of managing data as it flows in and out of memory, the memory controller is normally responsible for initiating these refresh cycles. However, SDRAM also has a low-power
self-refresh mode. In this mode, the memory uses an internal timer to generate its own refresh cycles, which allows the system to shut down the memory controller without endangering data currently held in memory. The kernel used in Fedora 20 can trigger memory self-refresh in Intel graphics adapters when they are idle, which saves around 0.8 W.
GPU clock reduction
Typical graphical processing units (GPUs) contain internal clocks that govern various parts of their internal circuitry. The kernel used in Fedora 20 can reduce the frequency of some of the internal clocks in Intel and ATI GPUs. Reducing the number of cycles that GPU components perform in a given time saves the power that they would have consumed in the cycles that they did not have to perform. The kernel automatically reduces the speed of these clocks when the GPU is idle, and increases it when GPU activity increases. Reducing GPU clock cycles can save up to 5 W.
GPU power-down
The Intel and ATI graphics drivers in Fedora 20 can detect when no monitor is attached to an adapter and therefore shut down the GPU completely. This feature is especially significant for servers which do not have monitors attached to them regularly.
Many computer systems contain radio transmitters, including Wi-Fi, Bluetooth, and 3G devices. These devices consume power, which is wasted when the device is not in use.
RFKill is a subsystem in the Linux kernel that provides an interface through which radio transmitters in a computer system can be queried, activated, and deactivated. When transmitters are deactivated, they can be placed in a state where software can reactive them (a soft block) or where software cannot reactive them (a hard block).
The RFKill core provides the application programming interface (API) for the subsystem. Kernel drivers that have been designed to support RFkill use this API to register with the kernel, and include methods for enabling and disabling the device. Additionally, the RFKill core provides notifications that user applications can interpret and ways for user applications to query transmitter states.
The RFKill interface is located at /dev/rfkill, which contains the current state of all radio transmitters on the system. Each device has its current RFKill state registered in sysfs. Additionally, RFKill issues uevents for each change of state in an RFKill-enabled device.
Rfkill is a command-line tool with which you can query and change RFKill-enabled devices on the system. To obtain the tool, install the rfkill package.
Use the command rfkill list to obtain a list of devices, each of which has an index number associated with it, starting at 0. You can use this index number to tell rfkill to block or unblock a device, for example:
rfkill block 0
blocks the first RFKill-enabled device on the system.
You can also use rfkill to block certain categories of devices, or all RFKill-enabled devices. For example:
rfkill block wifi
blocks all Wi-Fi devices on the system. To block all RFKill-enabled devices, run:
rfkill block all
To unblock devices, run rfkill unblock instead of rfkill block. To obtain a full list of device categories that rfkill can block, run rfkill help
3.13. Optimizations in User Space
Reducing the amount of work performed by system hardware is fundamental to saving power. Therefore, although the changes described in
Chapter 3, Core Infrastructure and Mechanics permit the system to operate in various states of reduced power consumption, applications in user space that request unnecessary work from system hardware prevent the hardware from entering those states. During the development of Fedora 20, audits were undertaken in the following areas to reduce unnecessary demands on hardware:
Reduced wakeups
Fedora 20 uses a
tickless kernel (refer to
Section 3.6, “Tickless Kernel”), which allows the CPUs to remain in deeper idle states longer. However, the
timer tick is not the only source of excessive CPU wakeups, and function calls from applications can also prevent the CPU from entering or remaining in idle states.
Reduced storage and network IO
Input or output (IO) to storage devices and network interfaces forces devices to consume power. In storage and network devices that feature reduced power states when idle (for example, ALPM or ASPM), this traffic can prevent the device from entering or remaining in an idle state, and can prevent hard drives from spinning down when not in use. Excessive and unnecessary demands on storage have been minimized in several applications. In particular, those demands that prevented hard drives from spinning down.
Initscript audit
Services that start automatically whether required or not have great potential to waste system resources. Services instead should default to "off" or "on demand" wherever possible. For example, the
BlueZ service that enables Bluetooth support previously ran automatically when the system started, whether Bluetooth hardware was present or not. The
BlueZ initscript now checks that Bluetooth hardware is present on the system before starting the service.
Appendix A. Tips for Developers
Every good programming textbook covers problems with memory allocation and the performance of specific functions. As you develop your software, be aware of issues that might increase power consumption on the systems on which the software runs. Although these considerations do not affect every line of code, you can optimize your code in areas which are frequent bottlenecks for performance.
Some techniques that are often problematic include:
using threads.
unnecessary CPU wake-ups and not using wake-ups efficiently. If you must wake up, do everything at once (race to idle) and as quickly as possible.
using [f]sync() unnecessarily.
unnecessary active polling or using short, regular timeouts. (React to events instead).
not using wake-ups efficiently.
inefficient disk access. Use large buffers to avoid frequent disk access. Write one large block at a time.
inefficient use of timers. Group timers across applications (or even across systems) if possible.
excessive I/O, power consumption, or memory usage (including memory leaks)
performing unnecessary computation.
The following sections examine some of these areas in greater detail.
It is widely believed that using threads makes applications perform better and faster, but this is not true in every case.
Python
Python uses the Global Lock Interpreter
, so threading is profitable only for larger I/O operations.
Unladen-swallow
is a faster implementation of Python with which you might be able to optimize your code.
Perl
Perl threads were originally created for applications running on systems without forking (such as systems with 32-bit Windows operating systems). In Perl threads, the data is copied for every single thread (Copy On Write). Data is not shared by default, because users should be able to define the level of data sharing. For data sharing the
threads::shared module has to be included. However, data is not only then copied (Copy On Write), but the module also creates tied variables for the data, which takes even more time and is even slower.
C
C threads share the same memory, each thread has its own stack, and the kernel does not have to create new file descriptors and allocate new memory space. C can really use the support of more CPUs for more threads. Therefore, to maximize the performance of your threads, use a low-level language like C or C++. If you use a scripting language, consider writing a C binding. Use profilers to identify poorly performing parts of your code.
Many applications scan configuration files for changes. In many cases, the scan is performed at a fixed interval, for example, every minute. This can be a problem, because it forces a disk to wake up from spindowns. The best solution is to find a good interval, a good checking mechanism, or to check for changes with inotify and react to events. Inotify can check variety of changes on a file or a directory.
For example:
#include <stdio.h>
#include <stdlib.h>
#include <sys/time.h>
#include <sys/types.h>
#include <sys/inotify.h>
#include <unistd.h>
int main(int argc, char *argv[]) {
int fd;
int wd;
int retval;
struct timeval tv;
fd = inotify_init();
wd = inotify_add_watch(fd, "./myConfig", IN_MODIFY);
if (wd < 0) {
printf("inotify cannot be used\n");
}
fd_set rfds;
FD_ZERO(&rfds);
FD_SET(fd, &rfds);
tv.tv_sec = 5;
tv.tv_usec = 0;
retval = select(fd + 1, &rfds, NULL, NULL, &tv);
if (retval == -1)
perror("select()");
else if (retval) {
printf("file was modified\n");
}
else
printf("timeout\n");
return EXIT_SUCCESS;
}
The advantage of this approach is the variety of checks that you can perform.
The main limitation is that only a limited number of watches are available on a system. The number can be obtained from /proc/sys/fs/inotify/max_user_watches and although it can be changed, this is not recommended. Furthermore, in case inotify fails, the code has to fall back to a different check method, which usually means many occurrences of #if #define in the source code.
For more information on inotify, refer to the inotify man page.
Fsync is known as an I/O expensive operation, but this is is not completely true.
Firefox used to call the sqlite library each time the user clicked on a link to go to a new page. Sqlite called fsync and because of the file system settings (mainly ext3 with data-ordered mode), there was a long latency when nothing happened. This could take a long time (up to 30 seconds) if another process was copying a large file at the same time.
However, in other cases, where fsync was not used at all, problems emerged with the switch to the ext4 file system. Ext3 was set to data-ordered mode, which flushed memory every few seconds and saved it to a disk. But with ext4 and laptop_mode, the interval between saves was longer and data might get lost when the system was unexpectedly switched off. Now ext4 is patched, but we must still consider the design of our applications carefully, and use fsync as appropriate.
The following simple example of reading and writing into a configuration file shows how a backup of a file can be made or how data can be lost:
fd = open("./myconfig", O_RDONLY);
read(fd, myconfig_buf, sizeof(myconfig_buf));
close(fd);
...
fd = open("./myconfig", O_WRONLY | O_TRUNC | O_CREAT, S_IRUSR | S_IWUSR);
write(fd, myconfig_buf, sizeof(myconfig_buf));
close(fd);
A better approach would be:
fd = open("./myconfig", O_RDONLY);
read(fd, myconfig_buf, sizeof(myconfig_buf));
close(fd);
...
fd = open("./myconfig.suffix", O_WRONLY | O_TRUNC | O_CREAT, S_IRUSR | S_IWUSR
write(fd, myconfig_buf, sizeof(myconfig_buf));
fsync(fd);
...
close(fd);
rename("./myconfig", "./myconfig~");
rename("./myconfig.suffix", "./myconfig");