
ps command allows you to display information about running processes. It produces a static list, that is, a snapshot of what is running when you execute the command. If you want a constantly updated list of running processes, use the top command or the System Monitor application instead.
psax
ps ax command displays the process ID (PID), the terminal that is associated with it (TTY), the current status (STAT), the cumulated CPU time (TIME), and the name of the executable file (COMMAND). For example:
~]$ ps ax
  PID TTY      STAT   TIME COMMAND
    1 ?        Ss     0:02 /usr/lib/systemd/systemd --system --deserialize 20
    2 ?        S      0:00 [kthreadd]
    3 ?        S      0:00 [ksoftirqd/0]
    5 ?        S      0:00 [kworker/u:0]
    6 ?        S      0:00 [migration/0]
[output truncated]psaux
ps ax command, ps aux displays the effective username of the process owner (USER), the percentage of the CPU (%CPU) and memory (%MEM) usage, the virtual memory size in kilobytes (VSZ), the non-swapped physical memory size in kilobytes (RSS), and the time or date the process was started. For instance:
~]$ ps aux
USER       PID %CPU %MEM    VSZ   RSS TTY      STAT START   TIME COMMAND
root         1  0.0  0.3  53128  2988 ?        Ss   13:28   0:02 /usr/lib/systemd/systemd --system --deserialize 20
root         2  0.0  0.0      0     0 ?        S    13:28   0:00 [kthreadd]
root         3  0.0  0.0      0     0 ?        S    13:28   0:00 [ksoftirqd/0]
root         5  0.0  0.0      0     0 ?        S    13:28   0:00 [kworker/u:0]
root         6  0.0  0.0      0     0 ?        S    13:28   0:00 [migration/0]
[output truncated]ps command in a combination with grep to see if a particular process is running. For example, to determine if Emacs is running, type:
~]$ ps ax | grep emacs
2625 ? Sl 0:00 emacstop command displays a real-time list of processes that are running on the system. It also displays additional information about the system uptime, current CPU and memory usage, or total number of running processes, and allows you to perform actions such as sorting the list or killing a process.
top command, type the following at a shell prompt:
toptop command displays the process ID (PID), the effective username of the process owner (USER), the priority (PR), the nice value (NI), the amount of virtual memory the process uses (VIRT), the amount of non-swapped physical memory the process uses (RES), the amount of shared memory the process uses (SHR), the percentage of the CPU (%CPU) and memory (%MEM) usage, the cumulated CPU time (TIME+), and the name of the executable file (COMMAND). For example:
~]$ top
top - 19:22:08 up  5:53,  3 users,  load average: 1.08, 1.03, 0.82
Tasks: 117 total,   2 running, 115 sleeping,   0 stopped,   0 zombie
Cpu(s):  9.3%us,  1.3%sy,  0.0%ni, 85.1%id,  0.0%wa,  1.7%hi,  0.0%si,  2.6%st
Mem:    761956k total,   617256k used,   144700k free,    24356k buffers
Swap:  1540092k total,    55780k used,  1484312k free,   256408k cached

  PID USER      PR  NI  VIRT  RES  SHR S %CPU %MEM    TIME+  COMMAND
  510 john      20   0 1435m  99m  18m S  9.0 13.3   3:30.52 gnome-shell
32686 root      20   0  156m  27m 3628 R  2.0  3.7   0:48.69 Xorg
 2625 john      20   0  488m  27m  14m S  0.3  3.7   0:00.70 emacs
    1 root      20   0 53128 2640 1152 S  0.0  0.3   0:02.83 systemd
    2 root      20   0     0    0    0 S  0.0  0.0   0:00.01 kthreadd
    3 root      20   0     0    0    0 S  0.0  0.0   0:00.18 ksoftirqd/0
    5 root      20   0     0    0    0 S  0.0  0.0   0:00.00 kworker/u:0
    6 root      RT   0     0    0    0 S  0.0  0.0   0:00.00 migration/0
    7 root      RT   0     0    0    0 S  0.0  0.0   0:00.30 watchdog/0
    8 root       0 -20     0    0    0 S  0.0  0.0   0:00.00 cpuset
    9 root       0 -20     0    0    0 S  0.0  0.0   0:00.00 khelper
   10 root      20   0     0    0    0 S  0.0  0.0   0:00.00 kdevtmpfs
   11 root       0 -20     0    0    0 S  0.0  0.0   0:00.00 netns
   12 root      20   0     0    0    0 S  0.0  0.0   0:00.11 sync_supers
   13 root      20   0     0    0    0 S  0.0  0.0   0:00.00 bdi-default
   14 root       0 -20     0    0    0 S  0.0  0.0   0:00.00 kintegrityd
15 root 0 -20 0 0 0 S 0.0 0.0 0:00.00 kblockdtop. For more information, refer to the top(1) manual page.
Table 16.1. Interactive top commands
| Command | Description |
|---|---|
| Enter, Space | Immediately refreshes the display. |
| h, ? | Displays a help screen. |
| k | Kills a process. You are prompted for the process ID and the signal to send to it. |
| n | Changes the number of displayed processes. You are prompted to enter the number. |
| u | Sorts the list by user. |
| M | Sorts the list by memory usage. |
| P | Sorts the list by CPU usage. |
| q | Terminates the utility and returns to the shell prompt. |
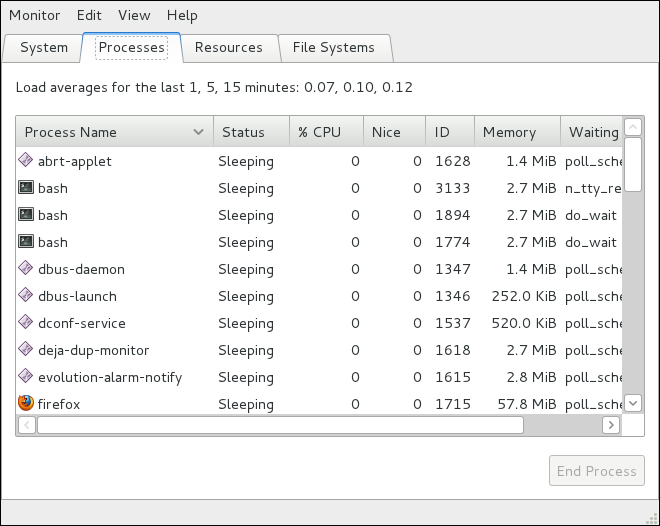
gnome-system-monitor at a shell prompt. Then click the Processes tab to view the list of running processes.